
TL;DR:
- Event journey analytics connects all attendee touchpoints for deeper engagement insights.
- Successfully tracking requires integrating multiple data sources with accurate identity resolution.
- Using multi-touch attribution and advanced metrics improves ROI measurement and pipeline impact.
Event marketers at mid-sized and large companies are under constant pressure to prove that events drive real business results. Yet most teams still measure success with a handful of basic numbers: total registrants, badge scans, and session headcounts. Those figures tell you what happened on the surface, but they completely miss the story underneath. Event journey analytics changes that. It connects every touchpoint, from pre-registration to post-event follow-up, into a unified picture of engagement and intent. This guide walks you through exactly how to use journey analytics to make smarter decisions, strengthen your pipeline, and demonstrate undeniable ROI. 📊
Table of Contents
- What is event journey analytics?
- Key data sources and integrations for journey analytics
- Best practices for measuring event ROI with journey analytics
- Advanced applications: Using AI and predictive analytics
- Why most event ROI tracking is outdated—and how to fix it
- Take your event analytics to the next level
- Frequently asked questions
Key Takeaways
| Point | Details |
|---|---|
| Go beyond attendance | Event journey analytics reveals true engagement across multiple touchpoints—not just who showed up. |
| Integrate all data streams | Combining offline and online signals unlocks accurate, actionable insights for event marketers. |
| Use advanced metrics | Metrics like velocity, lifetime value, and multi-touch attribution drive smarter decisions and higher ROI. |
| Address integration challenges | Proactively manage data silos and identity resolution for more reliable results. |
| Leverage AI for prediction | AI and machine learning enhance planning, follow-up, and ROI with powerful forecasting tools. |
What is event journey analytics?
Traditional event measurement is built on a simple question: how many people showed up? That question made sense when events were one-off moments with limited tracking options. But today, every interaction, a session attended, a booth scan, a content download, a follow-up email opened, leaves a digital footprint. Event journey analytics is the practice of capturing, connecting, and analyzing those footprints across the entire attendee lifecycle.
At its core, event journey analytics moves your reporting from a snapshot to a narrative. Instead of knowing that 800 people attended your conference, you understand that 320 of them attended two or more sessions, 140 engaged with a sponsor booth, 90 filled out a feedback survey, and 60 opened your post-event nurture sequence within 48 hours. That narrative is what drives intelligent follow-up and meaningful pipeline acceleration.
Understanding why event metrics matter is the first step toward building an analytics practice that actually supports revenue goals rather than just filling a post-event report.
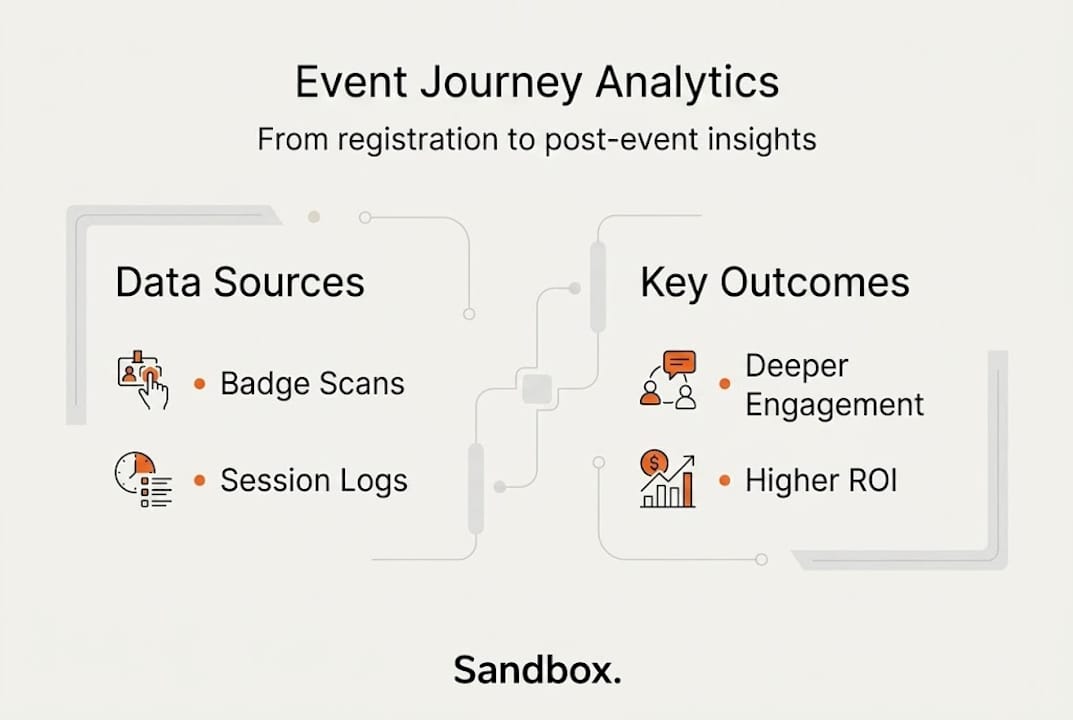
The core mechanics of event journey analytics involve collecting event-based data points such as registration, session attendance, booth scans, networking interactions, feedback surveys, and post-event actions like email opens or CRM updates, unified via identity resolution across platforms. Identity resolution is what makes all of this possible. It's the process of matching a badge scan at a booth to a contact in your CRM, to an email click the following week, so you see one person's complete journey rather than isolated data fragments.
Here are the typical touchpoints tracked in a complete event journey:
- 📋 Pre-event: Registration form, email confirmation opens, agenda page visits, app downloads
- 🎤 During event: Session check-ins, booth badge scans, networking meeting logs, live poll responses
- 📝 Immediate post-event: Feedback survey completions, resource downloads, social mentions
- 📧 Follow-up phase: Email opens and clicks, CRM activity updates, sales call bookings, content engagements
"The shift from counting heads to analyzing journeys is not just a measurement upgrade. It's a strategic transformation that reveals which moments actually move buyers forward."
Each touchpoint adds a layer of context. A first-time registrant who attended three sessions, visited two booths, and opened your follow-up email within 24 hours is a very different prospect than someone who registered and never showed. Journey analytics lets you treat them differently, with precision.
Key data sources and integrations for journey analytics
With an understanding of what event journey analytics encompasses, let's explore the data sources and integrations behind it.
The power of journey analytics comes from data breadth. No single system captures the full picture. You need signals from registration platforms, event apps, badge scanning systems, survey tools, email marketing platforms, and your CRM, all feeding into a central analytics layer. When these sources work in isolation, you miss connections that matter most.
Here are the most relevant data sources for a complete event journey view:
- 🗂️ Registration data: Form fields, ticket types, source attribution (how they found your event)
- 📱 Event app engagement: Session bookmarks, agenda views, in-app messaging activity
- 🔖 Badge scanning: Booth visits, session check-ins, expo hall entry times
- 🤝 Networking logs: Scheduled meetings, peer connections made, roundtable participation
- 📊 Survey responses: NPS scores, session ratings, intent-to-purchase questions
- 📧 Email platform data: Post-event open rates, click-through rates, nurture sequence progression
- 💼 CRM activity: Account updates, opportunity stage changes, sales notes from follow-up calls
Integrating these sources is where most teams hit friction. Event marketing automation tools help bridge these gaps by automating data flows between platforms, reducing manual exports and reconciliation work that eats up your team's time.
The trickiest challenge is identity stitching. When an attendee scans a badge at a booth using an RFID device, that scan generates a unique ID. Connecting that ID to the same person's CRM record and their email click requires a reliable matching layer. Event signal tracking solutions are specifically designed to handle this, linking offline and online signals without losing data accuracy.
![]()
The stakes are real: data silos cause 30-40% event inaccuracy, and offline-online stitching challenges like RFID to CRM matching create significant gaps in identity resolution. Meanwhile, B2B event cycles are long, often requiring 6-12 month attribution windows, and hybrid events now yield 2.5x attendance with a 3.1:1 ROI when tracked correctly. Those numbers are only achievable when your data sources are properly integrated from day one.
Pro Tip: Before your next event, map every data source your team will use and assign a clear owner for each integration. Waiting until post-event to reconcile siloed data is where attribution accuracy falls apart. Early alignment across your tech stack saves hours and protects data integrity when it counts most.
Best practices for measuring event ROI with journey analytics
Armed with integrated data, let's focus on measuring event success and ROI with the right metrics.
The most common mistake in event ROI measurement is using last-click attribution. Last-click attribution gives all revenue credit to the final touchpoint before a deal closes, completely ignoring every session attended, every booth conversation, and every follow-up email that built the relationship. Multi-touch attribution distributes credit across all meaningful interactions in the journey, giving you a far more accurate picture of where your event investment actually pays off.
Here are the key steps to build a strong ROI measurement framework:
- Define your attribution model before the event. Decide whether you'll use linear, time-decay, or position-based multi-touch attribution, and align your team on what counts as a touchpoint.
- Set baseline benchmarks. Use historical data to establish what a typical pipeline contribution from events looks like, so you can identify outperformance.
- Capture influenced pipeline, not just sourced pipeline. An event that accelerated 20 deals from Stage 2 to Stage 3 may be more valuable than one that sourced 5 new opportunities.
- Track velocity. Measure how much faster deals move after an event interaction compared to your standard sales cycle.
- Report on cost per lead (CPL) and conversion rates together. CPL alone without conversion rates gives a misleading picture of efficiency.
Here's how event benchmarks compare across formats:
| Metric | Traditional events | Hybrid events |
|---|---|---|
| Average ROI | 4.35:1 | 3.1:1 (in-person component) |
| Attendance rate | 52% of registrants | 2.5x registrant reach |
| Lead-to-opp conversion | 34% higher vs. digital | Comparable or higher |
| CPL range | $100-$400 | Varies by format |
| Visit-to-registration | 21.5% | Typically similar |
These empirical event marketing benchmarks tell a revealing story. Events carry a higher CPL than digital channels, sometimes 2.5x higher, but they also produce a 34% higher lead-to-opportunity conversion rate. That means the leads you generate at events are more likely to become real pipeline. Higher CPL is justified when conversion quality is meaningfully better.
⚡ Stat callout: Events drive a 34% higher lead-to-opportunity conversion rate compared to digital channels, making the higher CPL investment worth it when journey analytics confirms engagement quality.
The B2B lead generation strategies that work best combine these benchmarks with account-level data from your CRM, so you're not just tracking average performance but identifying which accounts engaged most deeply. Pairing that with a structured event conversion process gives your sales team a prioritized list of who to contact, and why, immediately after the event.
Only 40% of organizers now struggle to prove event ROI, down from 70% just a few years ago. Journey analytics is the main reason for that improvement, and it's a gap you should capitalize on now while competitors are still catching up.
Advanced applications: Using AI and predictive analytics
As analytics mature, let's look at how AI and predictive models are shaping the future of event measurement.
The next evolution of event journey analytics isn't just about reporting what happened. It's about predicting what will happen next, and acting on those predictions before opportunities cool off. AI and machine learning (ML) are making that possible, and early adopters are seeing significant advantages.
Here are the most impactful advanced applications right now:
- 🤖 Predictive ROI modeling: AI analyzes historical event data to forecast which upcoming events are most likely to generate pipeline, helping you allocate budget more confidently.
- 📈 Engagement scoring: ML models score each attendee based on their journey behavior, flagging high-intent prospects for immediate sales outreach.
- 🔍 Friction detection via event depth: Event depth analysis maps the sequence and depth of each attendee's interactions, revealing where drop-offs happen and which sessions create the most downstream pipeline movement.
- ⏩ Velocity tracking: Measures how quickly an account moves through pipeline stages after an event, identifying which event types and formats accelerate deals fastest.
- 💡 Lifetime value (LTV) modeling: Connects event participation history to long-term customer value, showing which event-sourced customers have the highest retention and expansion rates.
AI and ML tools for post-event ROI analytics show a 41% improvement in planning outcomes when teams use predictive models, and the shift toward influenced pipeline measurement (which captures 60% of event value that last-click attribution misses) is the single biggest unlock for mature event programs.
The event marketing automation benefits of connecting AI-driven scoring with automated follow-up workflows are substantial. When a high-intent attendee is identified in real-time, an automated sequence can trigger a personalized email from their account executive within hours of the session ending, not days later when the moment has passed.
Pro Tip: Use event depth scoring as your trigger for prioritizing post-event outreach. An attendee who engaged at depth 4 or higher (meaning they hit multiple touchpoints across multiple event phases) should be at the top of your sales team's call list. Depth is a stronger intent signal than session attendance alone, and it's often the metric that separates a warm prospect from a hot one.
Optimizing your post-event engagement process is where AI-driven insights translate into actual revenue. The analytics surface the signal. Your workflows determine whether that signal becomes pipeline.
Why most event ROI tracking is outdated—and how to fix it
Here's the uncomfortable reality: most event teams are still running their ROI tracking the way they did five years ago. They count attendees, tally badge scans, export a spreadsheet, and call it a report. Then they wonder why leadership keeps questioning the value of the events budget.
The real problem isn't a lack of data. It's a lack of connected data with a follow-up system built around it. Event-day metrics are only useful if they inform what happens on day two, week two, and month six. Pipeline velocity, influenced opportunities, and deal acceleration are where events prove their value, but those metrics live outside the event platform and require deliberate integration to capture.
We've seen firsthand that organizations treating measurable B2B customer acquisition as the outcome of their event program, rather than just a nice bonus, build fundamentally different processes. They instrument their events intentionally, they close the loop between follow-up and CRM, and they use journey data to coach their sales teams on exactly who to prioritize and what context to use.
The fix is not a new tool. It's a new mindset, one where events are treated as continuous GTM signals rather than isolated moments. When you build your measurement framework around the full journey, not just the event day, your reporting stops being a summary and starts being a strategy.
"Events are not just moments; they're catalysts for pipeline acceleration and ongoing engagement."
Take your event analytics to the next level
For teams ready to move beyond attendance reports and into real pipeline intelligence, Sandbox is built for exactly this. 🚀
Our platform connects the full event journey, from registration to closed-won, by combining event marketing ROI workflows with hands-on execution support. We help you capture intent signals, stitch offline and online data through CRM-driven event analytics, and turn that data into prioritized follow-up actions your sales team will actually use. If you want a clear view of your event performance metrics and a system built to make events accountable, Sandbox is where to start.
Frequently asked questions
How is event journey analytics different from traditional event metrics?
Event journey analytics tracks engagement across multiple touchpoints, not just attendance, providing a unified view via identity resolution across platforms including registration, booth scans, and post-event email activity.
What are the biggest challenges with event journey analytics?
Integrating offline and online signals is the core difficulty, since data silos cause 30-40% inaccuracy and RFID-to-CRM stitching creates significant identity resolution gaps that undermine reporting quality.
What ROI improvements can journey analytics deliver?
When tracking is set up correctly, hybrid events yield 2.5x attendance and a 3.1:1 ROI compared to traditional event formats, demonstrating the direct value of integrated journey measurement.
Which advanced metrics should I use beyond attendance?
Focus on velocity, lifetime value, event depth, and multi-touch attribution over last-click to build a more accurate and actionable picture of how events contribute to pipeline.
How long should my attribution window be for B2B events?
B2B sales cycles require 6-12 month attribution windows to accurately capture the full pipeline influence of an event, especially for enterprise deals that move slowly through multiple stages.