
You collect names at events. You send follow-up emails. Then silence. The disconnect between your event activity and actual revenue growth frustrates executives and leaves your team guessing which efforts matter. Without structured event insights analysis, you're flying blind while competitors turn their event programs into predictable pipeline engines. This guide shows you exactly how to bridge that gap.
Table of Contents
- Why Event Insights Analysis Matters
- Prerequisites And Required Tools
- Step 1: Portfolio-Based Event Analysis And Benchmarking
- Step 2: Capturing And Using Event Intent Data
- Step 3: Defining Kpis And Metrics For Revenue Impact
- Step 4: Post-Event Intent Capture And Activation
- Common Mistakes And Troubleshooting
- Expected Results And Outcomes
- Optimize Your Event Marketing With Sandbox Gtm
- Frequently Asked Questions
Key takeaways
| Point | Details |
|---|---|
| Event insights analysis transforms event marketing from logistics into a measurable revenue driver by linking activities directly to pipeline growth. | |
| Prerequisites include integrated tech stacks with real-time data capture, CRM connectivity, and cross-functional team alignment. | |
| A stepwise approach starts with portfolio benchmarking, captures intent data during events, defines revenue-aligned KPIs, and activates post-event playbooks. | |
| Avoid common pitfalls like siloed data systems, attendance-only metrics, and lack of executive buy-in that undermine analysis accuracy. | |
| Realistic outcomes include 20-40% ROI uplift, 50%+ attendance rates, and measurable pipeline acceleration within 3 months of implementation. |
Why event insights analysis matters
Event insights analysis goes far beyond counting badge scans. It's the systematic process of capturing, measuring, and connecting event participant behaviors to business outcomes like pipeline creation and deal acceleration. Most teams still equate event success with attendance numbers alone. That approach misses the strategic value events bring when properly analyzed.
The shift matters because executive leaders require pipeline and deal acceleration metrics beyond attendance to justify event budgets. Mid-sized to large enterprises now treat events as first-class growth channels, not logistics exercises. When you measure only who showed up, you ignore critical signals like content engagement, meeting quality, and buying intent that predict revenue impact.
Common misconceptions hold teams back. Many assume high attendance automatically means success. Others believe event ROI is too complex to measure accurately. Both are wrong. With the right approach, you can trace specific event interactions to closed deals and quantify exactly which event formats drive the best returns.
Key benefits of insights analysis include:
- Strategic resource allocation based on proven event format performance
- Faster lead velocity through prioritized follow-up on high-intent prospects
- Executive confidence in event budgets tied to measurable revenue contribution
- Competitive advantage from data-driven event optimization cycles
Enterprise trends in 2026 emphasize accountability. Marketing teams face pressure to prove contribution at every stage. Event insights analysis transforms your program from a cost center into a revenue engine with clear attribution.
Prerequisites and required tools
Before diving into analysis, you need the right foundation. Technology integration forms the backbone of effective event insights. Your event platform must connect seamlessly with your CRM, marketing automation, and analytics systems. Successful event analysis requires integrated event tech stacks including real-time data capture, CRM connectors, and analytics dashboards to enable timely insights and automated workflows.
Real-time data capture matters more than post-event surveys. Live engagement signals from session attendance, content downloads, booth visits, and meeting participation reveal intent while it's fresh. Delayed data collection loses context and accuracy. Your tech stack should log every meaningful interaction automatically without manual data entry.
Team capabilities prove equally critical. You need people comfortable with:
- Data analysis and visualization tools like dashboards and reporting platforms
- Event marketing strategy and execution from planning through follow-up
- Cross-functional coordination between marketing, sales, and operations teams
- CRM workflows and lead scoring methodologies
Pro Tip: Align your sales development and account management teams early in the planning process. When they understand which event signals indicate buying intent, follow-up becomes strategic rather than generic. This alignment often cuts lead response time in half.
Data readiness extends beyond technology. Establish naming conventions, lead scoring rules, and attribution models before your first event. Inconsistent data structures make analysis impossible later. Document your KPI definitions and measurement protocols so every team member captures information the same way.
The ultimate 2026 event tech stack guide provides practical examples of integration architectures that work at enterprise scale. Review it to identify gaps in your current setup.
Budget for integration work. Connecting systems requires technical resources and often custom API development. Plan for 4 to 8 weeks of setup time depending on your tech complexity. The investment pays back quickly when your team stops manually compiling spreadsheets and gains real-time visibility instead.
Step 1: Portfolio-based event analysis and benchmarking
Analyzing events individually misses the bigger picture. Portfolio-based analysis aggregates data across all events to reveal patterns and set realistic performance benchmarks. This approach helps you predict outcomes, allocate budgets wisely, and optimize event formats systematically.

Start by cataloging every event your team runs annually. Include conferences, trade shows, webinars, roadshows, and executive dinners. For each event, track core metrics like registrations, attendance, session completion rates, and post-event pipeline contribution. When you view these collectively, trends emerge that single-event analysis hides.
Benchmark averages from mid-sized to large enterprise event programs show approximately 25 events per year, 52% average attendance rates, and 95% session completion for well-designed agendas. Use these as starting points, then refine based on your industry and audience segments. See how your portfolio compares using event portfolio benchmarking practical examples to guide your analysis.
Format and agenda design significantly impact engagement. Interactive workshops typically achieve higher completion rates than passive keynote sessions. Structured networking with AI-powered matchmaking outperforms open networking halls. Test different formats within your portfolio and measure which drive the best outcomes.
| Traditional Approach | Portfolio-Driven Analysis |
|---|---|
| Measures each event independently | Aggregates data across all events to identify trends |
| Focuses primarily on attendance counts | Tracks attendance plus engagement, pipeline, and revenue metrics |
| Budget decisions based on historical spend | Resource allocation optimized by format performance and ROI |
| Success defined by logistics execution | Success measured by business impact and revenue contribution |
Key portfolio metrics to track:
- Average cost per attendee across event types
- Pipeline dollars generated per event format
- Lead to opportunity conversion rates by event category
- Time to close for event-sourced deals versus other channels
Pro Tip: Rank your event formats by pipeline contribution per dollar spent. Double down on the top three formats and cut or redesign the bottom performers. Most teams discover that 20% of their events drive 80% of pipeline impact. Reallocating budget based on this data typically improves overall ROI by 30% or more.
Review your portfolio quarterly. Event performance shifts as market conditions and audience preferences evolve. Regular benchmarking keeps your strategy aligned with what actually works rather than what worked last year.
Step 2: Capturing and using event intent data
Intent data reveals who's interested and why. During events, participants signal buying intent through content engagement, meeting requests, booth visits, and question quality. Capturing these signals in real time enables immediate, relevant follow-up that converts interest into opportunities.
Modern event platforms use AI to track and score intent automatically. When an attendee downloads three whitepapers on a specific topic, attends related sessions, and requests a demo, that's high intent. Your system should flag this person for priority outreach. Manual tracking can't keep pace at enterprise event scale.
Integration between your event platform and CRM is non-negotiable. Intent signals must flow automatically into lead records with timestamps and context. Sales teams need to see exactly which sessions someone attended and which content they consumed. This visibility transforms generic follow-up into personalized conversations that reference specific interests.
AI-powered event matchmaking significantly increases attendee networking ROI by smarter session recommendations and automated post-event reporting. The technology analyzes attendee profiles, preferences, and goals to suggest optimal connections. This creates higher quality meetings and better outcomes for everyone involved.
"Organizations using AI-powered matchmaking at events report 40% higher satisfaction scores and 2.5x more qualified leads per event compared to traditional networking approaches."
Key intent signals to capture include:
-
Session attendance patterns showing topic interest clustering
-
Content downloads indicating research stage and pain points
-
Meeting requests and duration showing relationship building intent
-
Booth dwell time and interaction depth revealing product interest
-
Question quality during sessions demonstrating engagement level
Lead enrichment happens automatically when intent data flows into your CRM. Scoring models assign points based on signal strength. High scores trigger immediate sales outreach. Medium scores enter nurture campaigns. Low scores remain in awareness tracks. This tiering ensures appropriate follow-up intensity.
The ai-powered event matchmaking insights guide provides detailed implementation examples. Review it to understand how matchmaking algorithms work and how to configure them for your audience.
Test your intent capture system before your next major event. Run a pilot at a smaller event to validate data flows correctly from platform to CRM. Fix integration issues when stakes are low, not during your flagship conference.
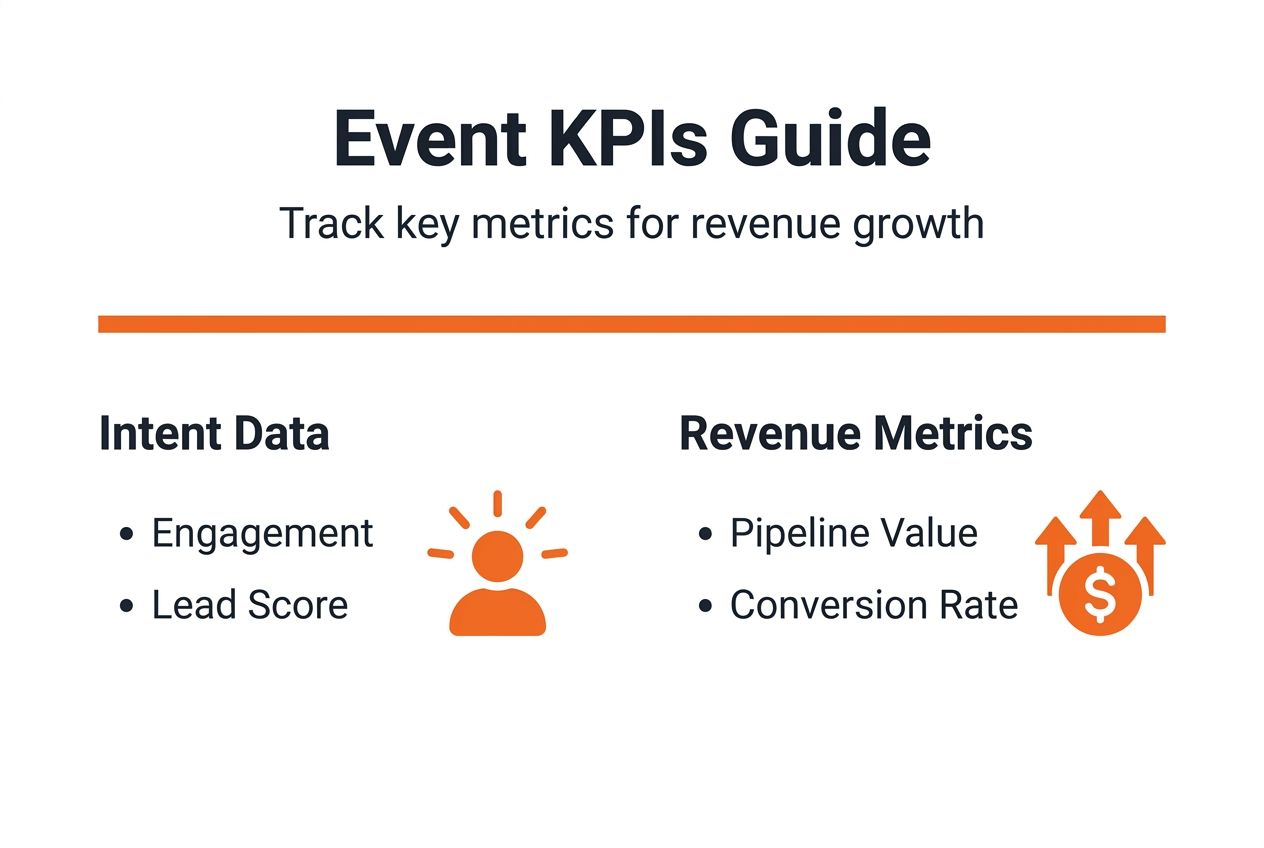
Step 3: Defining KPIs and metrics for revenue impact
Without clear KPIs, you can't prove event value or optimize performance. The right metrics connect event activities directly to business outcomes executives care about: pipeline creation, deal acceleration, and revenue growth. Choose KPIs that align with your organization's strategic goals.
Categorize your KPIs into four tiers:
-
Attendance metrics like registration rate, show-up rate, and attendee demographics
-
Engagement metrics including session completion, content downloads, and networking meeting counts
-
Pipeline metrics such as marketing qualified leads generated, sales accepted leads, and opportunity creation rate
-
Revenue metrics covering influenced pipeline dollars, closed-won deals, and event-attributed revenue
Map each KPI to a specific business objective. If your goal is demand generation, focus on MQL volume and conversion rates. If you're accelerating existing deals, track opportunity progression and deal velocity for event attendees versus non-attendees. Alignment creates accountability and makes budget conversations easier.
Benchmark ROI figures for B2B trade shows typically range from 20% to 40% when measured properly. Calculate ROI by dividing event-attributed pipeline or revenue by total event costs including staff time. Track this consistently across your portfolio to identify which event types deliver the best returns.
Follow these steps to select and align KPIs:
-
Start with business goals set by executive leadership for the quarter or year
-
Identify which event activities directly support each goal
-
Choose 3 to 5 KPIs per event tier that measure progress toward those goals
-
Set baseline targets using portfolio benchmarks or industry standards
-
Review and adjust targets quarterly based on actual performance data
| Metric Category | Example KPI | Target Value | Measurement Frequency |
|---|---|---|---|
| Attendance | Registration to attendance rate | 50-60% | Per event |
| Engagement | Session completion rate | 90-95% | Per event |
| Pipeline | Event-sourced MQLs | 15-25% of total MQLs | Monthly |
| Revenue | Event-attributed pipeline | $500K-$2M per major event | Quarterly |
Avoid vanity metrics that look impressive but don't predict outcomes. Social media mentions, booth traffic counts, and swag distribution numbers rarely correlate with revenue. Focus on metrics that move the needle on deals.
Document your KPI definitions in a shared resource accessible to marketing, sales, and operations teams. When everyone uses the same formulas and attribution windows, reports stay consistent and trustworthy. Inconsistent definitions undermine credibility and waste time in reconciliation meetings.
Review KPI performance in regular pipeline meetings. Connect event metrics to broader demand generation and sales discussions. This integration positions events as a strategic channel rather than a separate marketing activity.
Step 4: Post-event intent capture and activation
Events don't end when attendees leave. Post-event activation converts captured intent into pipeline through structured follow-up workflows. Speed matters. Leads contacted within 24 hours convert at significantly higher rates than those reached a week later.
Structured playbooks ensure consistent follow-up quality. Create templates for different intent levels. High-intent leads get immediate sales outreach with personalized meeting invites referencing specific event interactions. Medium-intent leads enter targeted nurture sequences. Low-intent contacts receive general awareness content.
Measured uplift from following structured post-event playbooks ranges from 25% to 45% improvement in lead to opportunity conversion rates. The discipline of systematic follow-up eliminates the random, inconsistent outreach that wastes the intent you worked hard to capture during the event. Explore an example of structured post-event engagement to see workflow design in practice.
Common pitfalls that fragment post-event data include:
-
Using disconnected tools for registration, event engagement, and CRM that don't sync
-
Manual data exports that introduce delays and errors
-
Lack of clear lead ownership causing duplicated or missed follow-up
-
Generic email blasts that ignore individual intent signals captured during the event
-
No closed-loop reporting connecting follow-up activities back to event source
Avoid these mistakes by automating as much as possible. Configure your event platform to push data to your CRM immediately. Set up triggered email sequences and task assignments based on lead scores. Build dashboards that show follow-up completion rates so managers can identify gaps quickly.
Pro Tip: Create a 48-hour activation sprint immediately after major events. Block sales calendars for focused outreach. Provide pre-written email templates and call scripts that reference specific sessions or meetings. This concentrated effort while context is fresh dramatically improves connection rates and meeting bookings. Teams using this approach often double their event-sourced pipeline compared to standard follow-up practices.
Track post-event metrics including outreach completion rate, response rate, meeting booking rate, and ultimate conversion to opportunity. These process metrics reveal where your playbook breaks down so you can fix weak points before the next event.
Schedule a post-event debrief within one week. Review what worked, what didn't, and how to improve the playbook. Document lessons learned and update your templates. Continuous improvement compounds across your event portfolio.
Common mistakes and troubleshooting
Even experienced teams make predictable mistakes that undermine event insights analysis. Recognizing these pitfalls helps you avoid them and correct course quickly when issues arise.
Inconsistent data capture causes lost leads and inaccurate analysis. When different team members use different naming conventions or skip required fields, your database becomes unreliable. Standardize data entry protocols and enforce them through system validations. Train staff thoroughly before each event.
Measuring only attendance without pipeline attribution leaves you blind to actual impact. You might host well-attended events that generate zero pipeline. Without attribution, you can't tell which events deserve more investment. Implement multi-touch attribution models that credit events appropriately alongside other marketing touches.
Siloed CRM handoffs impair lead management when event data stays trapped in the event platform. Sales teams can't act on insights they can't see. Break down silos by requiring real-time data sync and creating unified dashboards accessible to both marketing and sales.
Failing to align metrics with business goals produces reports that executives ignore. If leadership cares about pipeline growth but you report on social engagement, you're talking past each other. Start every planning cycle by confirming which business objectives matter most, then design your measurement framework accordingly.
Lack of executive buy-in and cross-functional collaboration dooms even well-designed analysis programs. When leadership doesn't value event insights, teams don't prioritize data quality or follow-up discipline. Secure executive sponsorship by demonstrating quick wins. Show how event insights helped close a specific deal or accelerated an important opportunity.
Recommendations to fix these issues:
-
Create a data governance document defining required fields, naming conventions, and quality standards
-
Build attribution models that assign partial credit to events based on engagement depth and timing
-
Establish weekly syncs between marketing and sales to review event-sourced pipeline and coordinate follow-up
-
Develop an executive scorecard showing only the 5 metrics leadership cares most about
-
Share success stories regularly highlighting how event insights drove specific revenue outcomes
Troubleshoot systematically when results disappoint. Check data quality first. Garbage in means garbage out. Verify integrations are working correctly. Review playbook execution to ensure follow-up actually happens. Test different approaches with small pilot events before rolling changes across your full portfolio.
Most problems stem from process breakdowns rather than technology failures. Focus on workflow design and team accountability as much as on tools and platforms.
Expected results and outcomes
Implementing event insights analysis delivers measurable improvements across multiple dimensions. Setting realistic expectations helps you stay committed through the learning curve and celebrate progress appropriately.
Attendance improvement targets typically reach 50% or higher consistent rates after optimizing registration processes and targeting based on portfolio learnings. You'll understand which audience segments respond best to which event formats. This knowledge improves targeting precision and reduces wasted invitations.
Session completion rates over 95% become attainable when you design agendas using engagement data from previous events. You'll know which session lengths, topics, and formats hold attention. Apply these insights to create compelling experiences that attendees complete rather than abandon midway.
ROI benchmarks show 20% to 40% uplift from portfolio-driven insights compared to traditional event management approaches. This improvement comes from better resource allocation, higher lead quality, and faster follow-up. The effect compounds over time as your optimization cycles improve.
Lead conversion velocity increases measurably within 3 months of implementing structured intent capture and activation playbooks. When sales teams receive prioritized leads with rich context, they connect faster and close more deals. Track time from event to opportunity and opportunity to close to quantify this acceleration.
Key outcome metrics to monitor:
-
Percentage of MQLs sourced from events increasing quarter over quarter
-
Average deal size for event-sourced opportunities compared to other channels
-
Win rates for deals where prospects attended events versus those who didn't
-
Payback period shortening as event efficiency improves
Typical pipeline contribution: Well-optimized event programs contribute 15% to 25% of total pipeline for mid-sized to large enterprise B2B organizations. Top performers reach 30% or higher by treating events as a primary demand generation channel.
Timeline expectations matter. Immediate improvements in data quality and follow-up speed happen within weeks. Pipeline impact becomes visible within one quarter. Revenue attribution takes two to three quarters as deals progress through sales cycles. Plan for a 6 to 12 month horizon to see full results.
Celebrate early wins to maintain momentum. When you close your first deal with clear event attribution, share that story widely. When attendance rates improve at a specific event type, document what changed. These visible successes build organizational confidence in your approach and make future improvements easier to implement.
Optimize your event marketing with Sandbox GTM
Turning event insights into revenue requires the right platform and partnership. Sandbox GTM transforms high-intent event moments into measurable pipeline signal through integrated technology and expert support designed specifically for enterprise event marketers.
Our platform combines real-time data capture with CRM connectivity and AI-powered intent analysis. You'll know who to follow up with, why they matter, and what to do next. Structured workflows automate the discipline required for consistent post-event activation, improving conversion rates while reducing manual effort.
Sandbox GTM treats events as first-class growth channels, not logistics exercises. We help mid-sized to large enterprises in North America connect event activity directly to pipeline and revenue through opinionated GTM workflows backed by hands-on execution support. Whether you're running your first program or scaling a flagship conference, Sandbox GTM event marketing solutions provide the systems, signal, and support to make events accountable and worth repeating.
Frequently asked questions
How often should event insight benchmarks be updated?
Update benchmarks quarterly to reflect market changes and program evolution. Review your portfolio performance every 90 days and adjust targets based on recent results. Annual reviews are too infrequent in fast-moving B2B markets.
What tools integrate best with existing CRMs for intent data?
Look for event platforms with native Salesforce and HubSpot integrations that sync bidirectionally in real time. Zapier can bridge gaps but introduces delays. Modern platforms like those in the 2026 tech stack guides offer pre-built connectors that work immediately.
How to get executive buy-in for event insights investment?
Start with a pilot event that demonstrates quick ROI. Show how intent data helped close a specific deal faster or identified a high-value prospect leadership cares about. Executives respond to revenue stories, not process improvements. Frame the investment in pipeline dollars rather than technology costs.
What are signs that an event program needs deeper analysis?
Warning signs include declining attendance despite stable budgets, inability to connect events to closed deals, sales teams ignoring event leads, and executive questioning of event value. If you can't answer how much pipeline came from events last quarter, you need better analysis immediately.
How long after events should follow-up playbooks run?
Initiate high-priority outreach within 24 hours while context is fresh. Run structured sequences for 2 to 3 weeks post-event for medium-intent leads. Maintain awareness touches for 90 days. Speed matters most for hot leads, but systematic nurture improves overall conversion across all segments.