
TL;DR:
- Event measurement should connect attendee actions to pipeline and revenue impacts.
- Outcome metrics focus on business results like deals closed and revenue generated.
- Advanced models evaluate incremental revenue, deal acceleration, and profit contribution for accurate ROI.
Most event teams know how many people attended. They can tell you how many badge scans happened, how many social posts got likes, and how many rooms reached capacity. But when a CFO asks what the event actually did for revenue, those numbers fall flat. Event activity measurement is not about collecting data points. It is about connecting what happened at your event to what happened in your pipeline. This article will help you understand the real difference between activity and impact, compare measurement approaches, and apply advanced frameworks that actually move the needle. 📊
Table of Contents
- Understanding event activity measurement
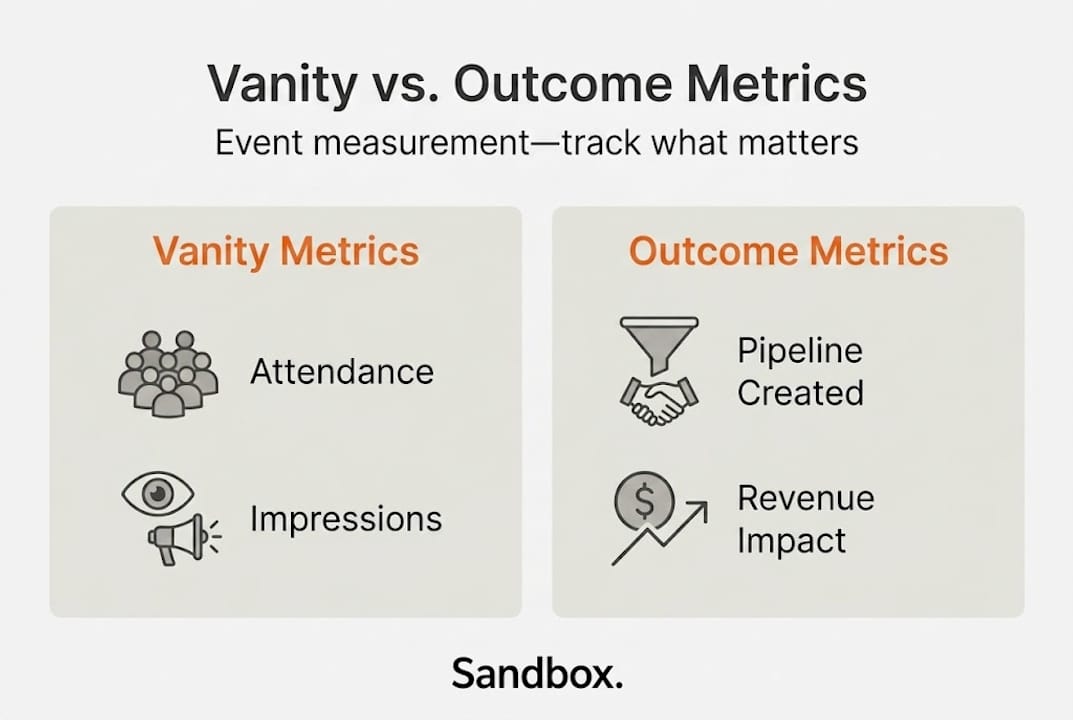
- Comparing key event metrics: Vanity vs. outcome
- From activity to impact: Connecting metrics to business outcomes
- Applying advanced models: Maximizing event ROI
- Why the conventional wisdom on event measurement needs to change
- Boost ROI with smarter event measurement
- Frequently asked questions
Key Takeaways
| Point | Details |
|---|---|
| Move beyond vanity metrics | Tracking attendance or impressions alone misses the full business impact of your events. |
| Connect activity to outcomes | Linking event actions to pipeline and revenue reveals what drives demand and growth. |
| Adopt advanced ROI frameworks | Incremental revenue and margin measurements provide a true picture of event value. |
| Optimize follow-up strategies | Event activity insights help tailor post-event outreach for better conversion rates. |
Understanding event activity measurement
Event activity measurement is the practice of capturing what attendees do at your event and using that data to understand business results. It is broader than registration counts or session attendance. It includes booth visits, meeting completions, content downloads, demo requests, and live conversation signals. Each of these behaviors tells a story about buyer intent. Done right, understanding why event metrics matter is the foundation of a growth-oriented event program.
Here is where most teams go wrong. They focus on activity without ever asking what that activity influenced. Did the attendee who visited your booth three times end up in an active deal? Did the executive who sat through your keynote accelerate a stalled conversation? These are the questions that separate event programs that prove value from those that simply produce reports.
The core distinction is between activity and impact:
- Activity metrics capture what happened: attendance, check-ins, session views, badge scans, social impressions
- Impact metrics reveal what changed: new pipeline created, deals accelerated, revenue closed, influenced opportunities
Vanity metrics like footfall and impressions often dominate post-event reports, while outcome metrics like pipeline and revenue, and the influence events have on accelerating deals that account for roughly 60% of event value, rarely get the attention they deserve. Most organizations default to what is easy to count rather than what is meaningful to track.
Why does this gap exist? In many organizations, event teams own the logistics but not the pipeline data. They do not have access to CRM systems, or they lack the infrastructure to connect event touchpoints to deal stages. Without that connection, the best you can do is report on surface numbers and hope leadership draws the right conclusions.
A solid foundation in event activity reporting means defining your metrics before the event starts, not after. Know what you are tracking. Know how each metric connects to a business outcome. Set up your capture systems, whether that is CRM integrations, badge scan tools, or conversation tracking, before the doors open.
Pro Tip: Build your measurement plan alongside your event agenda. If you are hosting a product demo session, define what a "successful" outcome looks like in terms of pipeline stage movement before the event starts. That way, you are measuring intent, not just attendance.
Comparing key event metrics: Vanity vs. outcome
Once you understand what event activity measurement is, the next step is getting honest about what you are currently measuring and why it may not be serving you. This comparison is where many teams have an "aha" moment. 💡
Vanity metrics are numbers that look good in a presentation but do not help you make decisions. Examples include:
- Total attendance or footfall
- Social media impressions and likes
- Email open rates for event promotions
- Number of sessions offered
- General satisfaction scores (without behavioral context)
Outcome metrics are numbers that connect event activity to revenue. Examples include:
- Net new pipeline generated from event contacts
- Number of deals influenced or accelerated
- Revenue closed from event-sourced opportunities
- Meeting-to-opportunity conversion rate
- Average deal cycle reduction for event-touched prospects
Here is a side-by-side look at what each approach reveals:
| Metric type | What it measures | What it misses | Best used for |
|---|---|---|---|
| Vanity metrics | Volume and reach | Business impact | Awareness programs |
| Outcome metrics | Pipeline and revenue | Brand perception | Demand generation |
| Activity metrics | Attendee behaviors | Attribution clarity | Segmentation |
| Impact metrics | Deal influence and acceleration | Short-term optics | Executive reporting |
"Over 60% of event value comes from acceleration and influenced deals, not new pipeline creation. Yet most event reports focus exclusively on net-new opportunities."
This is a critical insight. If your event helped close three deals that had been stuck in negotiation for 90 days, that is enormous business value. But if you are only counting new leads, you will completely miss it. The deal acceleration story is often the most compelling proof point for event ROI, and it is almost always invisible in standard reports.
Tracking event engagement at the right level of granularity is what makes the difference. Instead of "500 people attended your session," you want to know which of those 500 were active pipeline accounts, which had conversations with sales, and which took a follow-up action within 72 hours.
The benefits of shifting to an outcome-based tracking approach are significant:
- Better budget justification because you can show direct revenue contribution
- Smarter follow-up because you know who showed the highest intent
- Stronger sales alignment because both teams are working from the same data
- Clearer program decisions because you know which event formats drive results
The move from vanity to outcome metrics is not just a reporting upgrade. It is a strategic shift in how your organization treats events as a growth channel.

From activity to impact: Connecting metrics to business outcomes
Knowing the difference between activity and impact is one thing. Actually connecting the two in a way your sales team and leadership will trust is another challenge entirely. Here is a practical approach. 🔗
Steps to connect event activity to pipeline and revenue:
-
Map attendee segments before the event. Pull a list of registered attendees and cross-reference it with your CRM. Tag which contacts are in active deals, which are target accounts, and which are net new. This gives you a baseline for measuring movement.
-
Define trackable touchpoints during the event. Decide in advance which interactions signal high intent. Examples include a meeting with an account executive, a hands-on product demo, a whitepaper download, or a repeated booth visit. These touchpoints become your intent signals.
-
Capture data in real time. Use badge scanning, app check-ins, or structured note-taking by sales reps to log every meaningful interaction. Do not rely on memory after the fact. The data quality degrades fast.
-
Update your CRM within 24 hours. Log event interactions as activities tied to the correct contact and deal records. This is how you create the attribution chain that connects event attendance to deal progression.
-
Measure deal movement at 30, 60, and 90 days post-event. Compare the deal velocity and close rates of event-touched accounts against a control group. This is where the incremental revenue story becomes clear.
-
Report on influenced pipeline, not just sourced pipeline. Sourced pipeline (deals where the event was the first touchpoint) is often small. Influenced pipeline (deals where the event accelerated or re-engaged an opportunity) is typically much larger.
📌 Statistical callout: Research shows that influenced deals contribute roughly 60% of total event value. If you are not measuring deal influence, you are likely underreporting your event's business impact by more than half.
The most common pitfall is focusing only on attendance numbers because they are available immediately. Attendance counts are easy to pull and easy to share, but they do not tell you anything about business impact. A 200-person event where 40 active opportunities were accelerated is worth far more than a 2,000-person event with zero pipeline movement.
Pro Tip: Build your event signal tracking infrastructure before you need it. Set up CRM fields for event attribution, train your sales team on logging event interactions, and establish a post-event review cadence that includes both marketing and sales data.
Applying advanced models: Maximizing event ROI
Basic ROI models for events tend to look like this: divide the revenue generated by the cost of the event, subtract one, and express it as a percentage. Simple. Easy to explain. And almost always misleading because it ignores the full picture of what events actually do for your business. 📈
Simple vs. advanced ROI models differ significantly in the value they reveal. Advanced models calculate incremental revenue and margin, accounting for deal acceleration, influenced pipeline, and lifetime customer value, which paints a far more accurate picture than a single input-output ratio.
Here is a comparison to make it concrete:
| Model type | Inputs | Outputs | Accuracy | Complexity |
|---|---|---|---|---|
| Simple ROI | Event cost, direct revenue | Basic percentage | Low to medium | Low |
| Influenced pipeline model | Event cost, pipeline touched | Influenced deal value | High | Medium |
| Incremental revenue model | Event cost, deal velocity delta | Revenue acceleration value | Very high | Medium-high |
| Margin-based model | Event cost, margin on closed deals | Net business contribution | Highest | High |
How to implement an advanced measurement model:
-
Start with incremental revenue. Ask: would this deal have closed at the same time, at the same value, without the event? If the answer is no, the delta is incremental revenue attributable to the event.
-
Calculate deal acceleration value. If an event shortened a deal cycle from 120 days to 60 days, and your average deal value is $80,000, that acceleration has real financial value in cash flow and capacity terms.
-
Include margin, not just revenue. Gross margin on event-influenced deals gives you a more accurate picture of business contribution. A $500,000 deal at 20% margin contributes less real value than a $300,000 deal at 60% margin.
-
Benchmark against non-event-touched accounts. Compare close rates, deal sizes, and cycle times for event-touched contacts versus similar accounts that did not attend. That differential is your event's measurable impact.
-
Build a repeatable measurement scorecard. Use this framework after every event. Over time, you will see patterns in which event formats, audience segments, and content types drive the most business impact.
Explore how marketing automation ROI tools can help automate parts of this measurement workflow, and review a detailed event ROI framework to structure your approach from start to finish.
Advanced measurement is not about making events look better than they are. It is about accurately capturing the full value your events create so you can make smarter investments and prove that events belong in your growth strategy.
Why the conventional wisdom on event measurement needs to change
Here is an uncomfortable truth: the event industry has a long history of measuring what is convenient rather than what is meaningful. Attendance numbers are available the morning after. Impressions populate automatically from social platforms. Satisfaction scores arrive in survey results within a week. These numbers are fast, they are shareable, and they feel like evidence of success.
But they are not. They are proxies. And in most B2B environments, proxies do not justify budgets.
We have seen event programs get cut not because they failed to generate value, but because the team could not prove the value they generated. The real problem was not the event. It was the measurement model. A well-run event that influenced six major deals but reported only attendance numbers looks invisible to a finance team reviewing spend.
The shift to intent-based event signal tracking is not a nice-to-have upgrade. It is the difference between event programs that survive budget cycles and those that get cut. The teams that win this argument are the ones who walked into the post-event review with deal influence data, pipeline contribution numbers, and a clear story about revenue acceleration.
Start building that story now, before your next event. 🚀
Boost ROI with smarter event measurement
Understanding the gap between activity and impact is the first step. The next step is putting the right systems in place to close that gap consistently.
Sandbox helps event marketing teams build the infrastructure to turn event signals into measurable pipeline. Our event marketing workflow solutions are designed to connect attendee behavior with revenue outcomes, so you always know who to follow up with and why. Explore how to use CRM-driven event ROI strategies to track deal influence and acceleration across your entire event program. And if you are building out your reporting framework, our guide to event performance metrics gives you a practical starting point. 📋
Frequently asked questions
What is event activity measurement?
Event activity measurement is tracking attendee behaviors and engagement at events to link activity with real business outcomes like pipeline and revenue. It goes beyond attendance counts to capture intent signals that connect directly to deal progression and business results, as shown by outcome-focused frameworks that distinguish footfall from actual revenue contribution.
Why should marketers care about outcome metrics instead of vanity metrics?
Outcome metrics demonstrate real business value by connecting event actions to pipeline and revenue, while vanity metrics only show superficial engagement like impressions or attendance. Research confirms that accelerated and influenced deals represent the majority of event-generated business value, making outcome tracking essential for accurate reporting.
How can event activity metrics be tied to follow-up strategies?
By capturing attendee interactions and tagging them in your CRM, you can prioritize follow-up based on intent level rather than generic attendance. Organizations that track influenced deal value can personalize outreach based on which touchpoints each contact engaged with, improving conversion rates significantly.
What's the difference between simple ROI models and advanced ROI models for events?
Simple ROI models use basic input-output calculations that divide revenue by cost, while advanced models track incremental revenue and margin to reflect the deeper business value of deal acceleration, influenced pipeline, and lifetime customer contribution.